Slicer is a tool in Power BI for interactive data filtering in reports. Slicers make it easy for users to adjust data displays, making reports more dynamic and tailored to specific needs. In this article, we explore how different types of slicers can improve data analysis and enhance report interactivity.
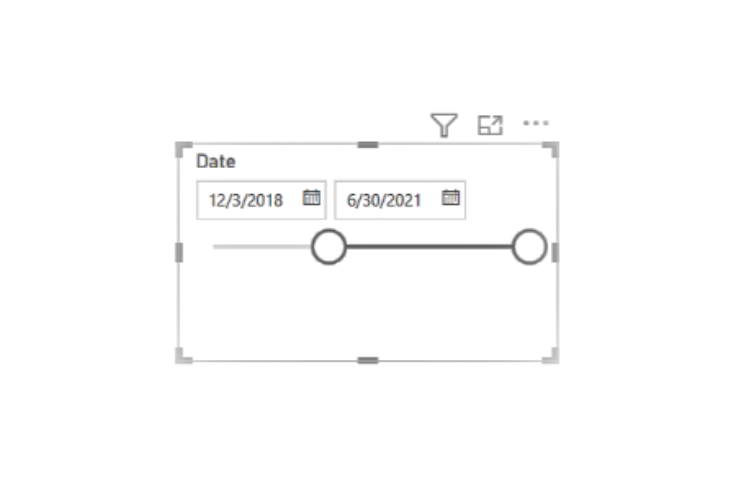
Number range slicers
This slicer filters data based on numerical ranges. For instance, in sales data analysis, a number range slicer can allow users to select transactions within a specific price range, providing targeted insights.
Relative date slicers
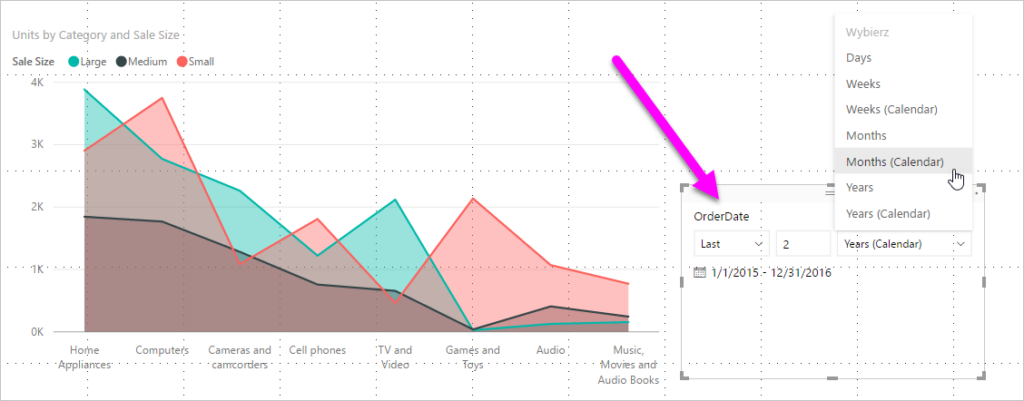
These slicers enable filtering data flexibly by time. Users can select periods like “last month” or “last year,” simplifying time-based analyses without manual date adjustments.
Relative time slicers
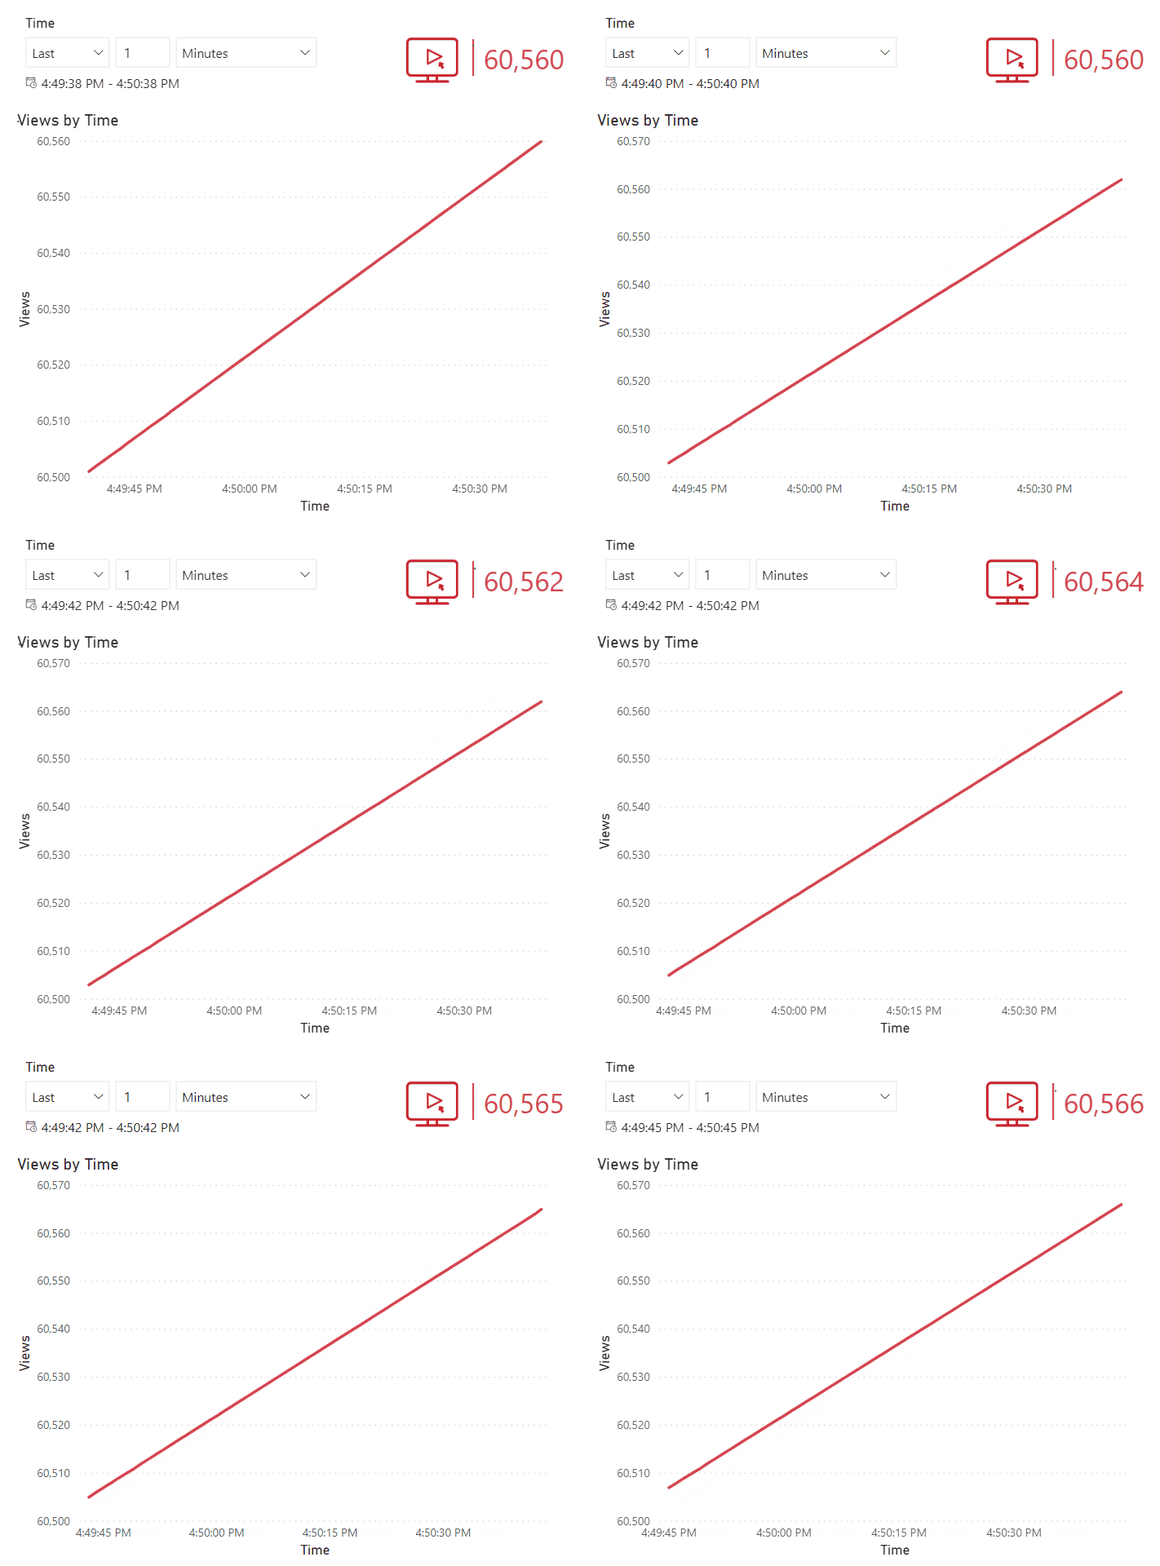
Similar to date slicers, time slicers allow filtering by time units, such as hours or weekdays. For example, they can display data from morning hours or specific workdays.
Dynamic resizable slicers
These slicers automatically adjust in size based on the data they represent. They are especially useful in environments with frequently updated data, ensuring user-friendly report layouts.
Hierarchical slicers with multiple fields
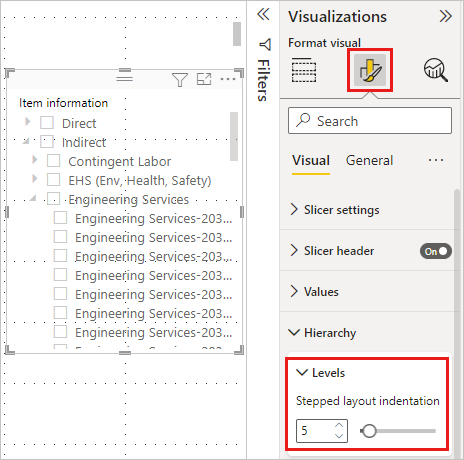
Hierarchical slicers filter data across multiple levels, such as categories, regions, and cities. They enable users to drill down into detailed data for comprehensive analysis.
Creating a slicer in Power BI
To add a slicer in Power BI:
- Open Power BI Desktop and select File > Open Report.
- Load a sample file like Retail Analysis Sample.
- In the left pane, navigate to Report.
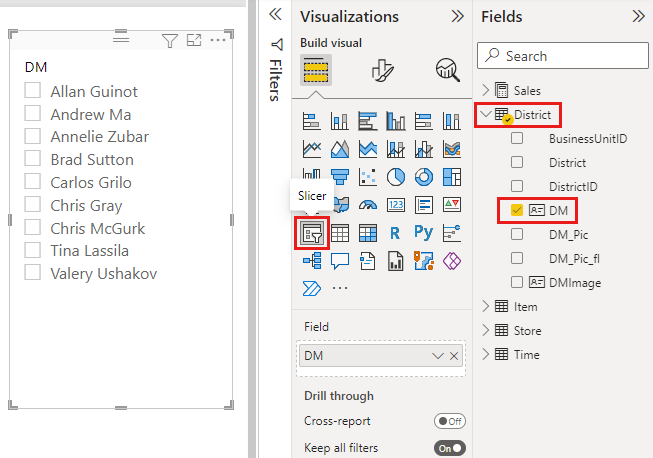
- Click the slicer icon in the Visualizations pane to add a new slicer.
- Expand the District table in the Fields pane and select DM to populate the slicer.
- Adjust the slicer’s size and position on the report canvas.
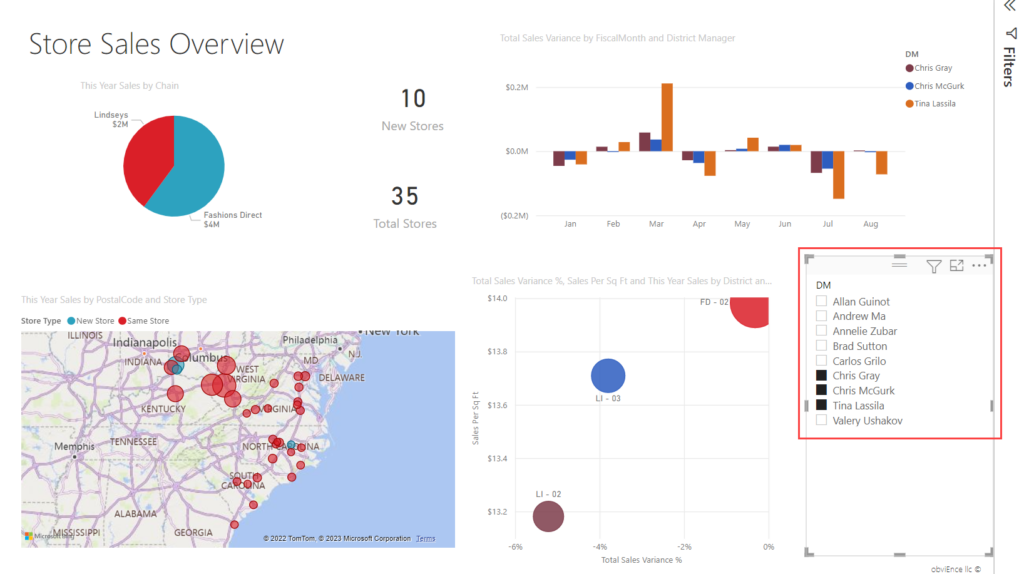
7. After setting up the slicer, select values to observe real-time data changes across other visuals.
Advanced slicer features in Power BI
Power BI offers a number of advanced features that extend the capabilities of slicers:
- Slicer synchronization – sync slicers across report pages for consistent filtering.
- Conditional formatting – customize slicer appearance based on selected data.
- Multi-value slicers – filter data using multiple dimensions simultaneously.
- Advanced filtering – use DAX to create custom measures for precise filtering.
- Excluding/complementing slicers – highlight or omit data dynamically.
Benefits of using slicers in Power BI
- Increased interactivity of reports – users can intuitively explore data.
- Better alignment of data with business needs – different types of slicers allow for precise analysis.
- Time savings – automatic filtering eliminates the need to manually search through data.
Summary
Slicers in Power BI offer robust tools for dynamic data filtering and report interactivity. From number ranges to advanced hierarchical slicers, they cater to diverse analysis needs. Their advanced features, like synchronization and custom filtering, enhance their utility.
If you’d like to harness the full potential of Power BI in your organization, contact us! Our experts can help you implement solutions to streamline data analysis and reporting.


