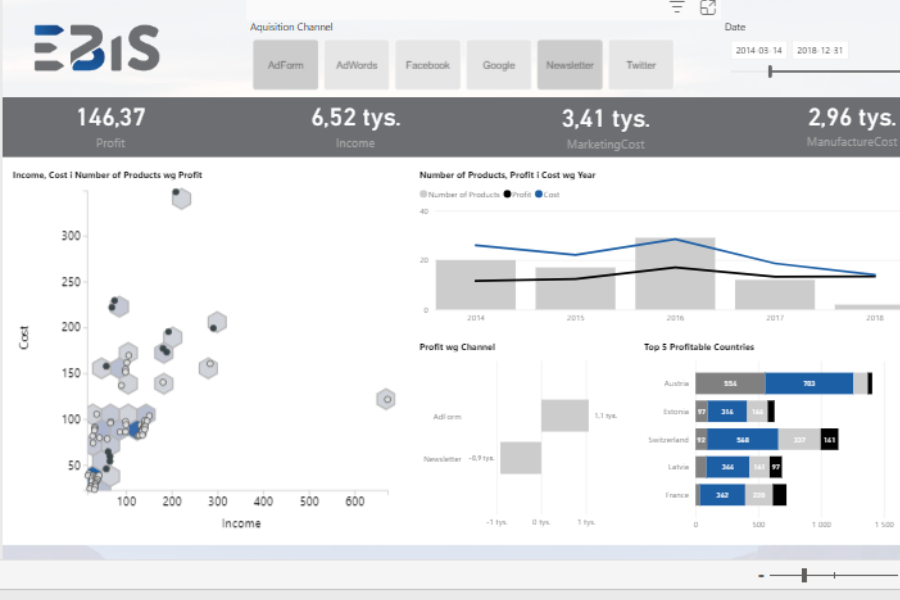
Data filtering
Filtering is one of the most important features of Power BI, allowing users to narrow down the scope of data presented according to their needs. Power BI allows for applying filters at the report, page, and visualization levels. This allows users to explore data more precisely and customize the report to current requirements. For example, report-level filtering can include time or location filters, making it easier to view data by time period or geographic region.
Designing effective reports
Creating effective Power BI reports requires proper planning and understanding the needs of the audience. At the beginning, it is worth analyzing for whom the report is being created and what information is key. The design process includes selecting appropriate visualizations, personalizing the report layout, and adjusting the color scheme and style so that they are consistent with the visual identification of the company. Well-designed reports are easy to interpret and intuitive for the audience, which increases their effectiveness.
Types of reports in Power BI
Power BI offers various types of reports that support companies in analyzing and presenting data:
- Analytical reports – designed to analyze historical data and identify trends, analytical reports provide detailed information about a company’s performance. With interactive charts, users can examine data at various levels of detail, making it easier to identify key factors that are driving results.
- Operational reports – aimed at ongoing monitoring of operations, these reports provide real-time information, helping to respond immediately to changing conditions. These reports are most often used in production, logistics or customer service departments, where quick response is key.
- Strategic reports – these reports are used at the board level and support top-level decision-making. They present key performance indicators (KPIs) and financial results, allowing assessment of whether the company is achieving its long-term goals.
Using reports in data analysis
Power BI reports are the ideal tool for data analysis, enabling large data sets to be quickly transformed into meaningful visualizations. This allows organizations to identify patterns, detect trends, and make more informed business decisions. Power BI also integrates with advanced predictive analytics models, giving companies a competitive advantage by allowing them to predict future changes based on current data.
Benefits of implementing Power BI
Implementing Power BI brings organizations a number of benefits, including better insight into data, faster decision-making processes, and increased operational efficiency. Power BI enables access to real-time reports, which is especially useful in dynamically changing industries. Thanks to the Power BI mobile application, users can view reports on any device, which increases their convenience and accessibility. Power BI is widely used in various sectors of the economy. In the trade industry, it allows for the analysis of sales results, which allows for the optimization of assortment and marketing strategies. In the financial sector, Power BI reports are used to monitor financial results, analyze risk, and forecast results based on historical data. In the area of human resources management, Power BI supports the analysis of employee turnover, efficiency, and team engagement, which helps to optimize HR policy.
Integration with other Microsoft tools
Power BI integrates with other Microsoft products, such as Excel, Dynamics 365, Azure, and SharePoint. This integration allows users to use data stored in different sources without having to manually transfer it. For example, data from Excel can be directly imported into Power BI and analyzed in the form of interactive visualizations. Additionally, integration with Azure provides access to advanced data analysis and cloud computing features.
How can EBIS help your business?
We are a company specializing in implementing and optimizing Microsoft Power BI and Fabric, supporting companies at various stages of data management. Our comprehensive range of services includes:
- Training – we organize training in Power BI and Microsoft Fabric, enabling employees to quickly acquire practical skills in working with data. Training participants learn how to create reports, visualize and analyze results in Power BI.
- Implementations – EBIS implements Power BI from scratch, adapting the tool to the individual needs of the organization. This process includes, among others, dashboard design, integration with existing systems and optimization for specific business requirements.
- Consulting/Support – after implementation, we offer ongoing support. A team of specialists answers customer questions and ensures the smooth operation of analytical tools.
If you are interested in Power BI or Fabric – contact us!


