


Challenges in financial analysis and reporting
Traditional reporting methods, mainly based on spreadsheets, come with several limitations:
- high risk of human errors during manual data entry and processing,
- long preparation times for reports, especially with large data sets,
- lack of real-time updates – data is often outdated when making decisions,
- difficulties in integrating data from various systems, such as ERP, CRM, or accounting software.
To overcome these challenges, companies are implementing Business Intelligence (BI) tools that automate analysis and increase financial transparency. One of the most popular solutions is Power BI in financial controlling.
Power BI in financial controlling – what are the benefits?
Microsoft Power BI is an advanced analytics platform that enables companies to transform raw data into clear and interactive reports. With Power BI, financial controlling becomes more efficient and precise.
Automation of reporting and elimination of human errors
Power BI enables automatic data retrieval and processing from various sources, minimizing the need for manual data entry. This reduces the risk of errors commonly found in Excel-based reports.
Real-time access to key financial indicators
Instead of waiting for monthly reports, management teams can monitor financial performance in real time based on up-to-date data. Power BI allows tracking Key Performance Indicators (KPIs) instantly, enabling quicker responses to changes.
Dynamic data analysis and forecasting
With Power BI, companies can analyze historical data and predict future financial results. Predictive models and artificial intelligence help organizations make more informed decisions.
Key Power BI features supporting financial controlling
Power BI offers various features that support financial controlling and improve financial management efficiency.
Data integration from various systems
Power BI allows integrating data from various sources, such as:
- ERP systems (SAP, Microsoft Dynamics, Oracle),
- accounting software and CRM systems,
- Excel spreadsheets, CSV files, and SQL databases.
This ensures that financial controlling is based on a complete financial picture rather than fragmented data.
Customized financial dashboards
Power BI enables the creation of interactive dashboards tailored to the organization’s needs, including:
- liquidity analysis,
- cost and revenue monitoring,
- budget vs. actual comparisons,
- profitability and margin indicators.
This provides managers with quick access to key financial information in a clear and intuitive format.
Advanced trend analysis and financial forecasting
Power BI offers trend analysis and future financial forecasts based on historical data. This allows for better planning and preparation for potential market changes.
Real-time KPI monitoring
Power BI enables real-time tracking of key financial metrics, such as:
• EBITDA (Earnings Before Interest, Taxes, Depreciation, and Amortization),
• Return on Sales (ROS),
• Liquidity ratios,
• Cash Flow.
This helps companies react faster to potential threats and make better business decisions.
How to implement Power BI in financial controlling?
To successfully implement Power BI in financial controlling, follow these key steps.
Analyzing needs and selecting key indicators
Start by identifying the most important financial indicators for your company, such as cost analysis, margin, liquidity, or budget tracking.
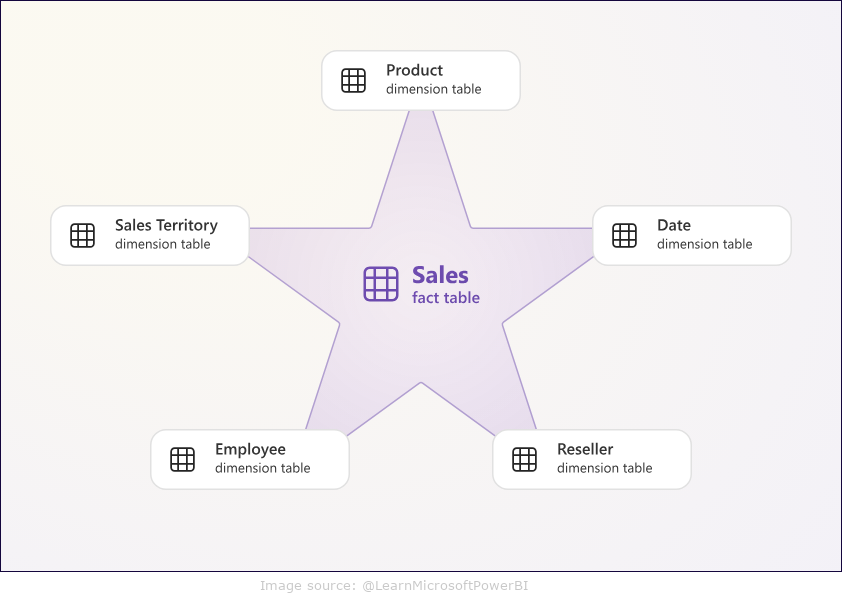
Data model structure: star schema and tabular model
Power BI utilizes a tabular model, enabling fast data processing and efficient analysis. Applying a star schema helps organize data and maintain consistency.
Team training and process optimization
To maximize Power BI’s potential, it’s essential to train your financial team on using the tool. Additionally, optimizing reporting and analysis processes ensures accurate and valuable insights.
Conclusion
Implementing Power BI in financial controlling is a step toward greater transparency and efficiency in financial management. With this tool, companies can:
- automate reporting and eliminate human errors,
- gain real-time access to key financial indicators,
- perform dynamic analyses and forecasts,
- integrate data from multiple systems in one place,
- monitor KPIs in real-time.
Want to implement Power BI in your company and improve financial control? Contact EBIS experts, who will assist with integrating this tool and maximizing its potential, including integration with Microsoft Fabric.
Discover how modern solutions can enhance financial transparency in your company! | CONTACT