


In this article, Power BI vs Tableau, we will examine which tool better meets the data analysis needs of companies. We will cover features, ease of use, performance, costs, and business applications.
What is Power BI and Tableau?
In the business world, data analysis tools have become an essential part of daily operations for companies of all sizes. Power BI vs Tableau offer different features, but both enable the creation of interactive reports and data visualizations, making it easier to make decisions based on reliable information.
Power BI is a solution developed by Microsoft that allows companies to integrate data from various sources – from ERP systems and Excel spreadsheets to marketing platforms and cloud services. Its main advantage is seamless integration with the Microsoft 365 ecosystem, making it easy to share reports and dashboards with colleagues, both on desktops and mobile devices.
Tableau, on the other hand, is known for its flexible visualizations and advanced real-time data analysis. It allows integration with diverse data sources and is praised for enabling the rapid creation of visually appealing reports that help uncover trends and patterns.
Features and Capabilities
When comparing Power BI vs Tableau, it is important to consider their main features:
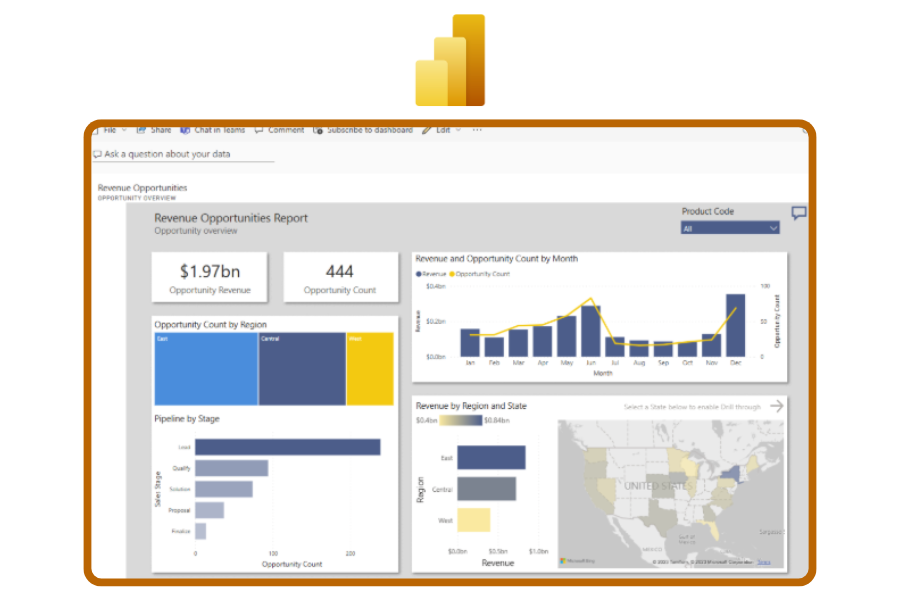
Power BI:
- Intuitive integration with Microsoft 365 and other Microsoft products.
- Interactive reports and dashboards available 24/7.
- Artificial intelligence – Copilot
- Easy data connection from multiple sources and automation of analytical processes.
- Built-in AI and predictive analytics capabilities.
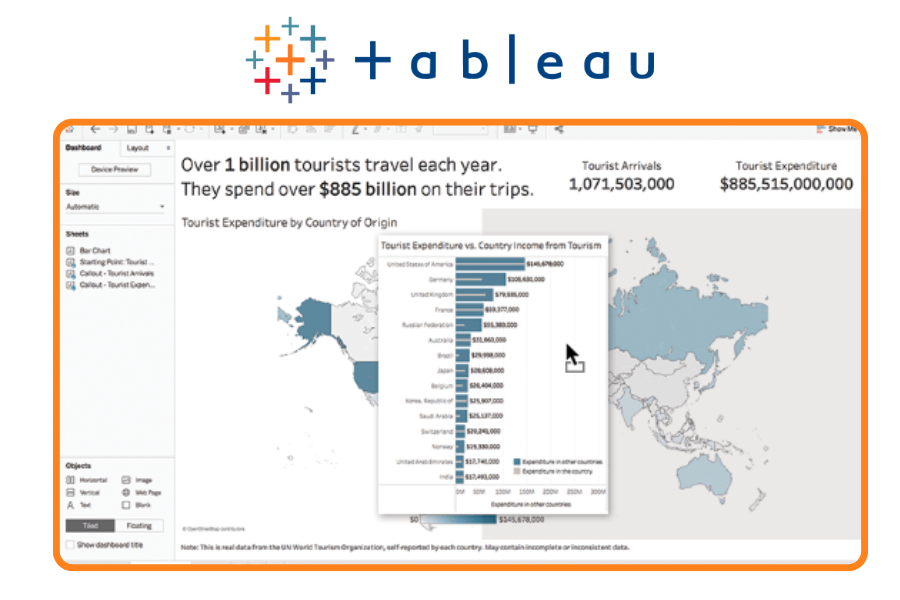
Tableau:
- Advanced visualizations and interactive charts.
- Real-time data analysis and exploration of large datasets.
- Ability to work with diverse data sources, both on-premises and in the cloud.
- Flexibility in customizing reports to meet individual user needs.
Comparison summary:
Although Power BI vs Tableau offer similar capabilities in terms of visualization and reporting, Power BI stands out for its ease of integration with the Microsoft ecosystem, lower entry costs, and user-friendly interface for business users, making it often a more practical choice for companies already using Microsoft 365. Tableau, on the other hand, is better suited for analytical teams that require maximum visual flexibility and advanced data exploration.
Costs and Licensing Models
One of the key factors when choosing a Business Intelligence tool is the cost and available licensing options. Both Power BI and Tableau offer subscriptions in a SaaS (cloud) model, but they differ in pricing structure and on-premises deployment capabilities.
Power BI stands out with attractive entry-level pricing. For business users, monthly Pro licenses are available, while organizations can opt for Premium licenses, which allow greater scalability and automation of reports. A Power BI subscription also includes integration with Microsoft 365, reducing additional implementation costs.
Tableau offers different license types: Creator, Explorer, and Viewer. This model can be more expensive with a larger number of users and requires additional infrastructure planning if a company chooses an on-premises deployment.
For companies selecting a BI tool, it is essential to compare costs against functionalities. In practice, Power BI often proves to be the more cost-effective choice for medium and large companies, especially those already using the Microsoft ecosystem.
Performance and Scalability
In terms of performance, Power BI vs Tableau demonstrate different approaches to data processing and solution scalability.
Power BI uses the VertiPaq engine, which allows for fast processing of large datasets and the creation of interactive reports in real time. Integration with Microsoft Azure cloud enables solutions to scale according to company needs, while automation of analytical processes reduces the IT team’s workload.
Tableau also handles large datasets well and supports real-time analysis, but in some scenarios, it requires additional server or infrastructure configuration, which can impact costs and deployment time.
In summary, if a company needs fast deployment, easy scalability, and low maintenance costs, Power BI is often the more practical choice compared to Tableau, while maintaining high performance and analytical flexibility.
Business Applications
Business Intelligence tools, such as Power BI and Tableau, are used across a wide range of industries – from finance and manufacturing, through retail, to marketing and the public sector. By integrating data from various sources, companies can respond quickly to market changes, optimize processes, and make fact-based decisions.
Examples of applications:
- Finance and Accounting: cash flow analysis, budget monitoring, revenue forecasting.
- Sales and Marketing: tracking marketing campaign performance, real-time sales analysis, identifying market trends.
- Manufacturing and Logistics: monitoring production line performance, analyzing supply chains, optimizing inventory.
- HR and Workforce Management: analyzing employment metrics, employee turnover, and training effectiveness.
Summary and Recommendations
In summary, Power BI vs Tableau, the choice of the best tool depends on the company’s analytical needs and organizational structure.
Power BI:
- Easy deployment and integration with Microsoft 365.
- Lower licensing and maintenance costs compared to Tableau.
- Quick creation of dashboards accessible on desktops and mobile devices.
- Built-in analytics and AI features, useful for business teams.
Tableau:
- Strong visualization capabilities and real-time data exploration.
- Flexible customization of reports for analysts’ needs.
- Suitable for companies requiring advanced data analysis with specialized BI teams.
Recommendation: For companies looking for a simple, fast-to-use, and cost-effective tool for reporting and data analysis, Power BI is often the better choice, while still providing high performance and broad integration capabilities.
Want to see how Power BI can improve data analysis in your company?
Schedule a free consultation.