Excel as a data analysis tool
Microsoft Excel has been one of the most popular tools for data analysis and reporting for many years. Its intuitive interface and versatility make it used by both small companies and large corporations. Excel allows users to perform complex calculations, build charts and create complex reports.
Advantages of Excel
- Ease of use – this is a tool that most people have been familiar with for years. Users do not have to learn new functions to get started. Its simplicity makes it ideal for small businesses and individual users.
- Flexibility in analysis – it allows you to create complex calculations, formulas and financial models. You can create summaries, comparisons and analyze data at a detailed level.
- Extensive functions – formulas, pivot tables and various analytical functions make Excel suitable for a wide range of applications, from simple calculations to complex financial analyses.
Excel limitations
Although Excel is very versatile, it has its limitations:
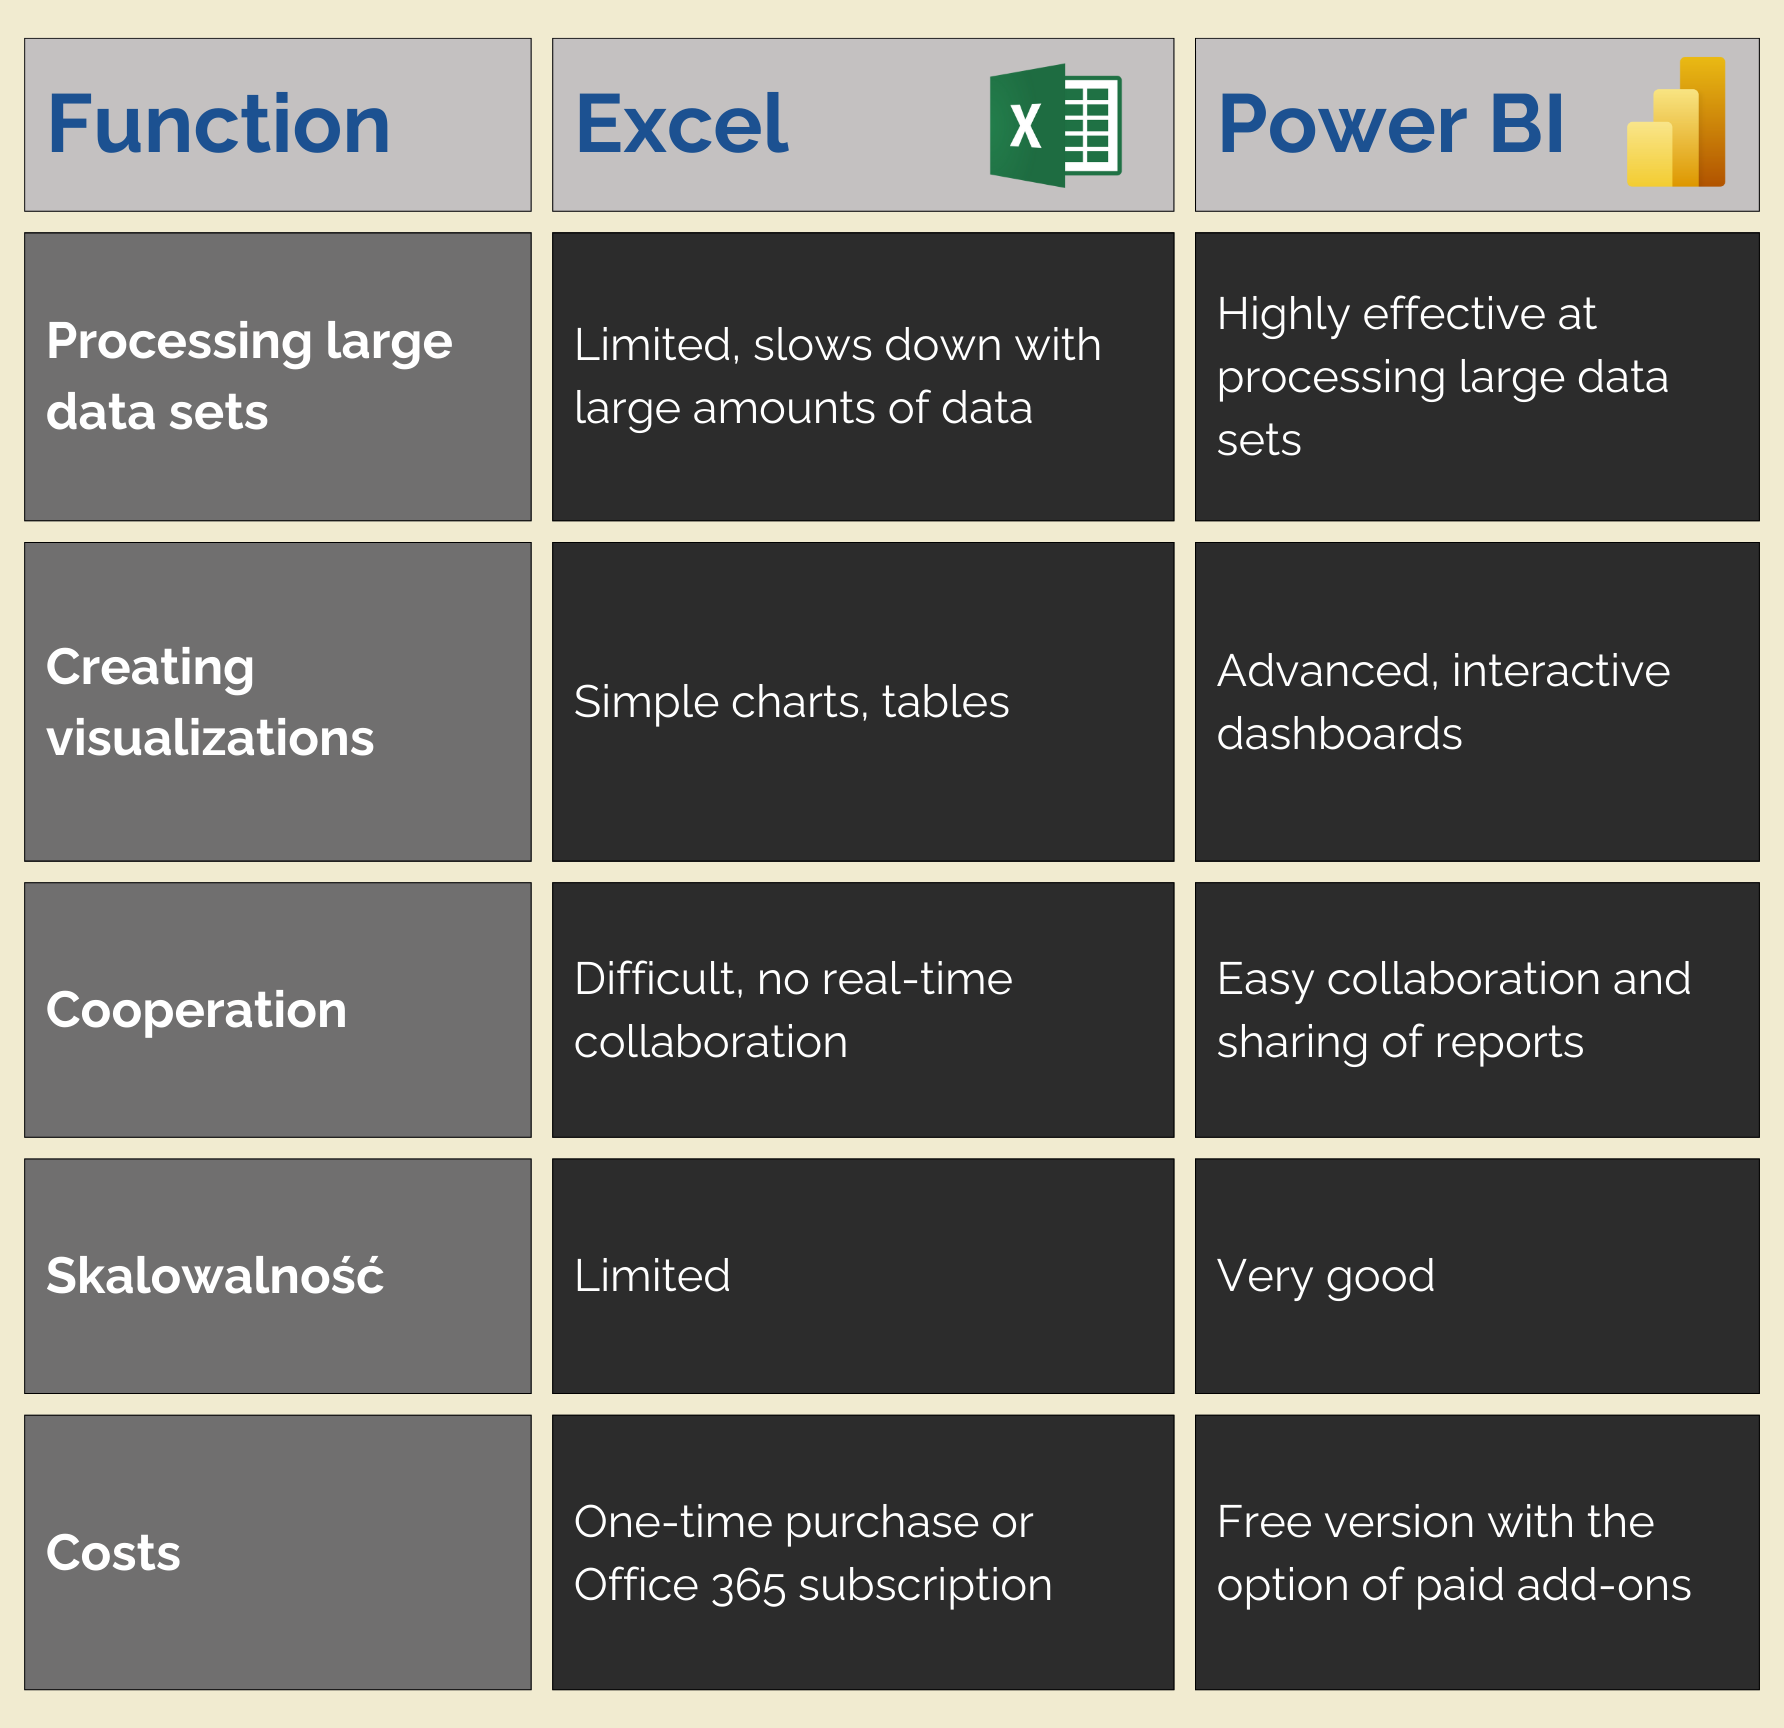
- Scalability and performance – Excel, while great for smaller data sets, becomes less efficient when processing larger data sets. Spreadsheets can slow down significantly when files exceed tens of thousands of rows. Complex calculations, nested formulas, and multi-level pivot tables add to the burden on the system, which can lead to program hangs or data loss.
- Lack of automation and data updates – Excel is a manual tool, which means that data must be entered and updated manually. The lack of automation and integration with dynamic data sources can be a limitation, especially when compared to tools like Power BI, which automatically sync data from databases, clouds, and other systems.
- Limited visualization capabilities – While Excel offers many chart and table options, its visualization capabilities are limited compared to more advanced tools.
- Lack of advanced analytical tools – Excel offers basic analytical features, such as pivot tables and complex formulas, but does not have built-in tools for more advanced analysis, such as machine learning, predictive modeling, or advanced data processing algorithms. Unlike Excel, Power BI offers full integration with Microsoft Azure services.
- Limited team collaboration – Collaborating on Excel files in real time is problematic. When working on the same file by multiple users, synchronization problems may occur, and working on shared files can lead to data loss or conflicts of changes. Compared to Power BI, which allows simultaneous collaboration on the same report, Excel remains a more individual tool.
- Security and versioning – Although Excel has basic security features, such as the ability to lock cells or add a password to a file, in the context of large organizations, these features may be insufficient. Excel does not provide advanced change tracking, document versioning or role-based access, which poses a risk to data security.
Power BI as an analytical tool
Power BI is a modern business analysis tool created by Microsoft. Its main goal is to visualize data and provide dynamic reports. Power BI is designed for companies that need an advanced tool for analyzing and presenting data in an interactive way.
Power BI benefits
Power BI is a Business Intelligence platform that offers many benefits, especially when compared to more traditional solutions like Excel. Here are the key benefits of this tool:
- Innovative visualization capabilities – Power BI allows you to create dynamic reports and interactive dashboards. Users can easily analyze data from various sources and present it in an attractive, understandable way.
- Scalability – the tool copes well with large data sets. Regardless of whether the data comes from ERP, CRM systems or external databases, Power BI allows for fast and efficient processing.
Integration with other Microsoft tools – integrates seamlessly with other Microsoft products, such as Excel, SharePoint or Azure. Thanks to this, users can use data from various sources in one place. - Integration with external solutions – integrates with tools outside the Microsoft ecosystem, making it a versatile data analysis tool. It supports integration with platforms such as Salesforce, Google Analytics or MailChimp, allowing users to combine data from CRM, marketing and other sources in a single report. Thanks to support for databases such as MySQL or SAP HANA, Power BI enables comprehensive operational and financial analysis.
- Team collaboration – allows you to easily share reports with other team members. Report versions are automatically updated, making collaboration much easier.
Power BI disadvantages
While Power BI is a very popular and respected analytical tool, it also has some drawbacks:
- Learning curve – Power BI is more complicated than Excel, especially for new users. There is a learning curve for new features, which may require additional training.
- Costs – Power BI Pro, or Premium, requires an additional fee, which may be higher than the Excel license costs.
Excel vs Power BI – Feature comparison
When to choose Excel and when to choose Power BI?
The choice between Excel and Power BI depends primarily on the scale of the company and the complexity of data analysis. Excel will work great in smaller companies that do not need reporting tools. Its functions are sufficient for basic analysis and presentation of data in everyday work.
However, for larger organizations, where the amount of data is growing and the analyses are becoming more complex, Power BI offers much more possibilities. Thanks to complex visualization functions, integration with many systems and scalability, Power BI becomes an indispensable tool that streamlines work with data and allows for drawing more precise conclusions.
If you are interested in the Power BI tool – contact us! We will provide you with comprehensive service from design to implementation and ongoing support. Our solutions will allow you to quickly respond to changes in the market, optimize processes and make better decisions based on data.

