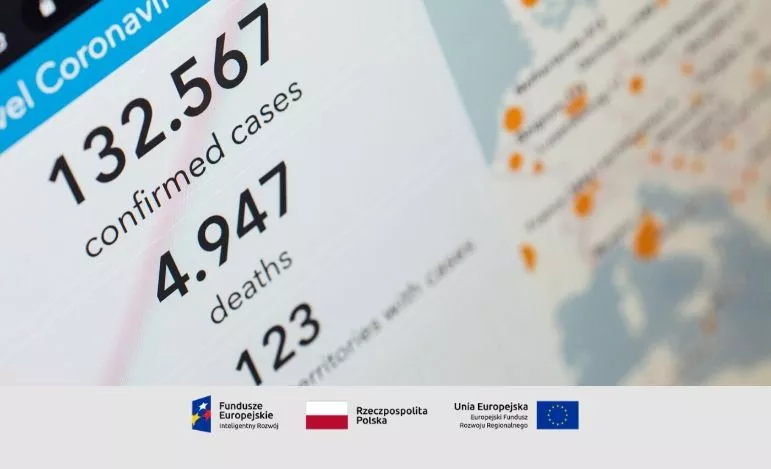
Data analysis in Power BI in the era of coronavirus
The medical sector is one of the many industries where data analysis is becoming increasingly used. Analytical tools such as Microsoft Power BI are becoming more and more popular – especially in the face of the ongoing coronavirus epidemic. This is not, of course, the first ever global epidemic threat – just to mention the Spanish flu that spread from 1918 to 1919. In the fight against another virus, but a hundred years later, we have much more advanced tools at our disposal. And it’s not just medical.
It is safe to say that now more than ever before, data analysis can change the world. How? The answer comes with new technologies, led by artificial intelligence, that help track the spread of the virus and can help stop it. At the heart of these efforts is something the healthcare sector is well acquainted with: data.
A better understanding of coronavirus through data analysis
Data analysis specialists use artificial intelligence, machine learning and natural language processing to track and stop coronavirus and to better understand the disease. In recent weeks, solutions to effectively detect coronaviruses have become increasingly important. Alibaba, a Chinese e-commerce giant, has prepared an artificial intelligence-powered diagnostic system to diagnose COVID-19 in just seconds. In turn, Terra Drone, also from China, used drones to transport medical samples and control people in quarantine. What’s more, the supercomputers can help scientists to quickly develop an effective coronavirus vaccine. The mechanisms developed will also prove successful in early detection of further potential epidemics.
Coronavirus tracking – interactive EBIS report
Power BI enables quick data aggregation and presentation in the form of interactive reports. An example of this is the clear report developed by EBIS, created in response to an ongoing epidemic threat. We present in it, using an interactive map and graphs, the place where COVID-19 infection was detected, together with the number of cases of disease, deaths and recoveries on a global scale. All information is updated automatically, based on data provided by GitHub.
Thanks to the convenient collection of data in one place and their percentage analysis, users can monitor the state of the epidemic in real-time. The interactive form of a map or report facilitates tracking and analysing the spread of the disease in subsequent countries – on a given day and over a more extended period. This, in turn, makes it possible to catch downward trends.
