


The ability to present data in an understandable and engaging way is key. Business Intelligence tools such as Power BI allow companies not only to analyze huge amounts of data, but also to visualize it effectively. Microsoft, understanding the needs of users, introduced a feature that integrates Power BI with PowerPoint, allowing the creation of interactive presentations based on current reports. In this article, we will present the benefits of this feature, how it can be used, and what examples of use can be observed in companies.
What is Power BI in PowerPoint?
Power BI in PowerPoint is a new feature introduced by Microsoft that enables direct integration of interactive Power BI reports with PowerPoint presentations. This allows users to insert not only static charts into their slides, but also interactive reports that can be explored during the presentation. This feature is especially useful in situations where it is necessary to adjust data or analyze it from different perspectives in real time, such as when presenting financial results or market analysis. This integration transforms traditional PowerPoint slides into a dynamic data presentation tool that allows for interaction and in-depth analysis without having to switch between different applications. Users can view detailed data, interact with charts and reports, and customize views depending on their needs.
Key benefits of integrating Power BI with PowerPoint
Interactivity
One of the key benefits of integrating Power BI with PowerPoint is the ability to interact with data in real time. In traditional presentations, data is static and limited to information that has been prepared before the meeting. With Power BI integration, presenters can respond to questions, change the scope of data, filter information, and provide precise answers to the needs of the audience.
Data update on an ongoing basis
Another important aspect of the integration is automatic data refresh. When a report in Power BI is updated, the changes automatically appear in the PowerPoint presentation. This means that users do not have to manually update charts or reports, which makes work much easier, especially in dynamic business environments where time is of the essence.
Simplicity of use
The Power BI integration with PowerPoint is designed with simplicity and ease of use in mind. Adding an interactive Power BI report to a slide is incredibly intuitive and takes just a few clicks. Users don’t need to have advanced technical knowledge to take advantage of this feature, making it accessible even to non-tech savvy individuals.
How to add a Power BI report to a PowerPoint presentation?
Adding a Power BI report to PowerPoint is quick and easy. Microsoft has made sure that this process is as intuitive as possible, so that every user can use this feature on their own without having to involve IT specialists. Below is a step-by-step guide on how to do it:
- Log in to Power BI. To add a report to PowerPoint, you must be logged in to your Power BI account and have access to the reports you want to include in your presentation.
- Open PowerPoint. In PowerPoint, go to the slide where you want to place the Power BI report.
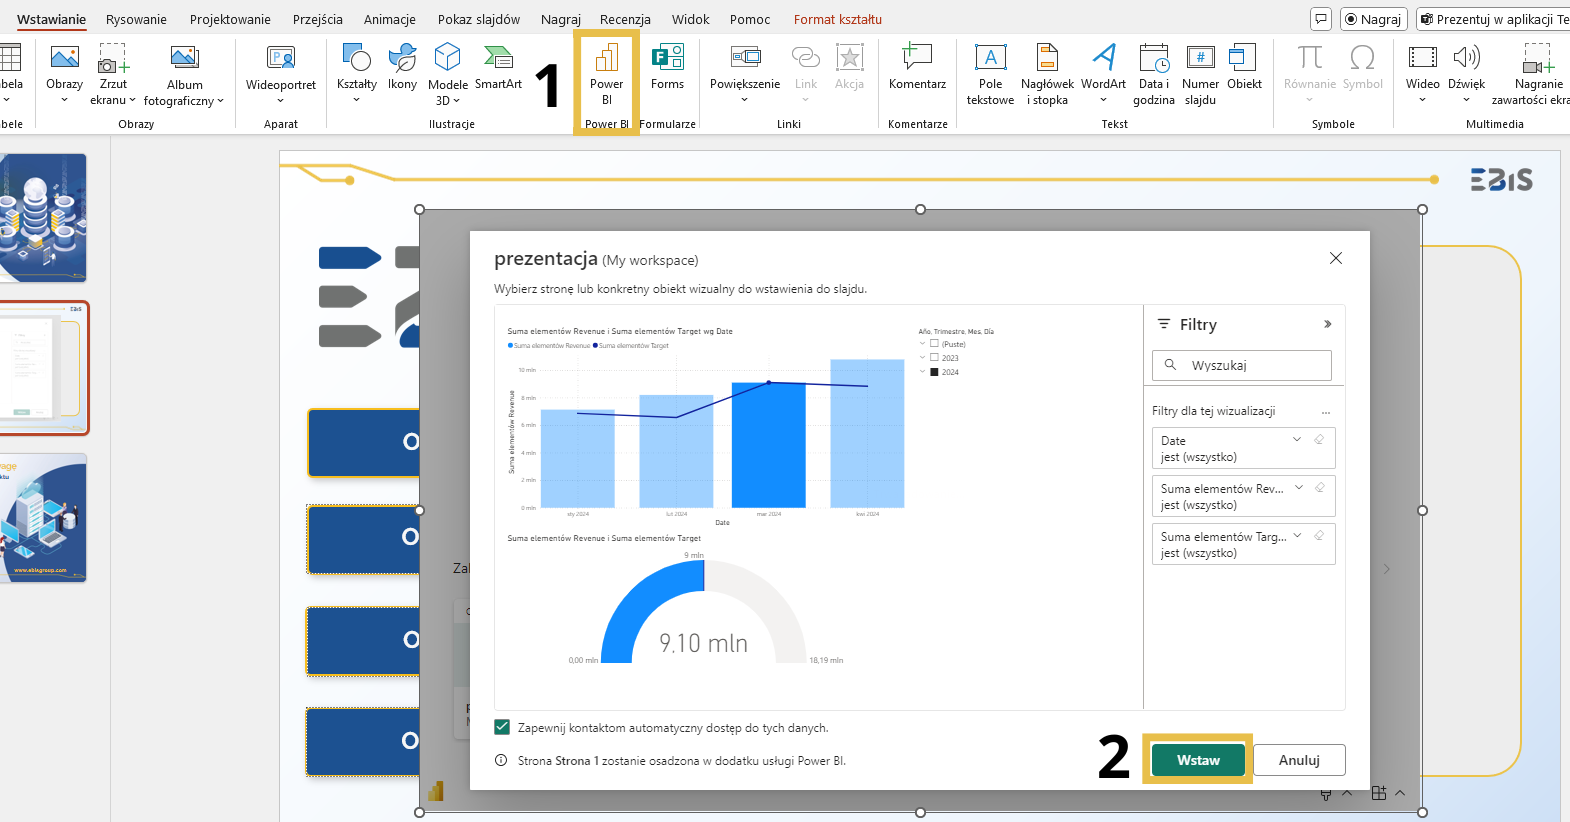
- Insert Power BI report. Select “Insert” from the toolbar, then click “Power BI Report.” Sign in to your Power BI account if you haven’t already, then select the report you want to place on your slide.
- Customize appearance and interactions. Once you’ve added a report, you can customize its size and the interactions that will be available during your presentation.
Examples of using Power BI in PowerPoint
Financial results presentations
One of the main uses of Power BI in PowerPoint is presenting financial results. Companies can adjust report views in real time, analyze financial data from different perspectives, and answer questions from management or investors without the need for additional tools. The ability to interact with data allows for a dynamic approach to analyzing results, which increases the effectiveness of presentations and facilitates decision-making.
Market analysis
During market analysis, Power BI integration with PowerPoint allows for quick comparison of data from different periods, regions or demographic groups. For example, when presenting the results of a marketing campaign, the user can quickly change the time frame or regions and show the impact of different strategies on business results. This makes presentations more flexible and tailored to the current needs of the audience.
Why is it worth implementing Power BI in PowerPoint in your company?
Increase the effectiveness of business presentations
Integrating Power BI with PowerPoint significantly increases the effectiveness of business presentations. Traditional slides, which were previously static, are transformed into interactive data analysis tools, allowing presenters to better respond to questions and needs of meeting participants.
Making decisions easier
With the ability to update data and interact with reports, users have access to the latest information, which allows them to make better decisions. In a dynamic business environment where decisions must be made quickly, such functionality is invaluable.
Better collaboration between teams
By working together on interactive reports, teams can more easily share data and analysis results. Power BI reports placed in PowerPoint presentations become more easily accessible to all team members, which promotes better collaboration and information exchange.
Summary
Power BI in PowerPoint is an innovative feature that changes the way companies present their data. Thanks to interactivity, automatic updating and simplicity of use, Power BI reports in PowerPoint presentations become a key tool supporting business decision-making. This integration allows for a more dynamic and flexible approach to data presentation, which translates into better work efficiency and more effective internal communication in the company. If you need help creating reports in Power BI – contact us!