


Many organizations work with business data that contains a location component — customer addresses, cities, regions, postal codes or coordinates. Yet these data points are often analyzed only in tables and charts, without considering the spatial context. Meanwhile, many key business questions are inherently location‑based, such as:
- which regions achieve the highest sales,
- where the most profitable customers are located,
- which areas offer the greatest growth potential,
- how marketing activities perform in specific locations.
ArcGIS for Power BI helps unlock the unused potential hidden in location-based data by connecting traditional analytics with geospatial analysis. Thanks to this, you can understand not only how much happened, but also where and why.
What is ArcGIS for Power BI
ArcGIS for Power BI is an advanced map visualization available directly in Power BI. It integrates the capabilities of GIS systems with standard reporting. It enables:
- presenting data on interactive maps,
- automatic geocoding of addresses,
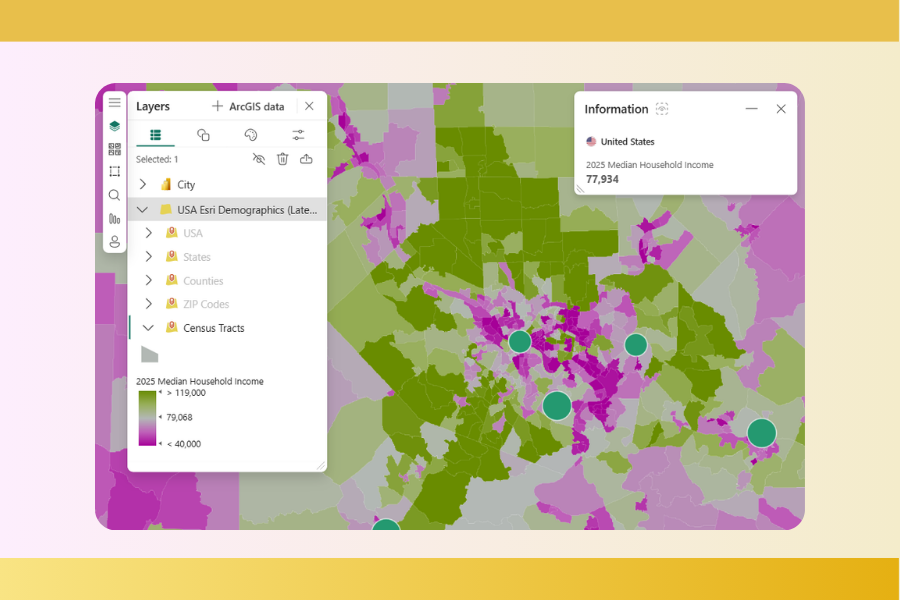
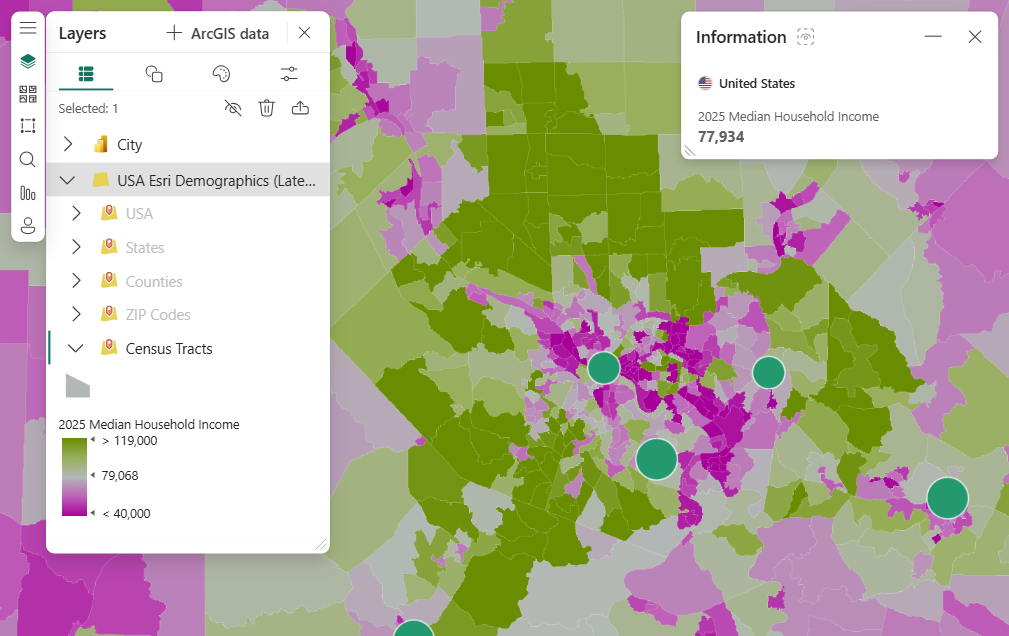
- adding geographic layers (e.g., administrative boundaries, demographic data),
- working with large and complex geospatial datasets.
Compared to the default Power BI map, ArcGIS provides more flexible configuration, higher geographic precision and access to professional spatial data sources.
What data can be analyzed
Any data linked to a location can be effectively visualized with ArcGIS. The most common data types include:
1. Sales data
- comparing results across regions, cities, and countries,
- identifying areas with low or high sales,
- detecting seasonal trends in specific locations.
Maps reveal differences that remain invisible in standard tables — for example, regions with many customers but low sales value.
2. Logistics and operational data
- placement of warehouses and distribution centers,
- delivery routes and service areas,
- locations generating delays or high operational costs.
ArcGIS makes it easier to assess the efficiency of logistics networks and plan improvements.
3. Marketing data
- campaign performance in different regions,
- identification of high‑potential market areas,
- comparing marketing results across territories.
By layering campaign outcomes over geographic data, it becomes clear where marketing investments deliver the best returns.
4. Customer data
- locating customer clusters,
- analyzing regional buying behavior,
- planning new stores or service locations.
Many companies discover geographic customer patterns only after incorporating maps into their analysis.
5. Data from multiple systems
ArcGIS for Power BI connects data from ERP, CRM, Excel, SQL databases and cloud services, allowing all analysis to happen in one environment.
Practical use cases of ArcGIS in business
ArcGIS expands Power BI’s analytical capabilities, enabling a spatial perspective on business data. Key use cases include:
Sales analysis by region
Maps allow quick comparisons of sales performance:
- where sales are highest,
- where they grow or decline,
- which regions require sales support.
Instead of reviewing multiple charts, users instantly see which areas generate the highest revenue.
Identifying market potential
ArcGIS overlays business data with spatial information to highlight:
- high‑potential regions,
- underserved areas,
- locations with strong competition.
This supports strategic planning and marketing budget allocation.
Customer location analysis
Helps reveal:
- where customers are concentrated,
- regional differences in purchase value,
- underserved potential customer segments.
The insights often influence adjustments to sales and service strategies.
Monitoring sales networks
For organizations with extensive sales structures, the map becomes a real‑time control tool:
- performance of branches,
- comparison of regional results,
- visibility of field sales activity.
Visualization allows faster problem detection and response.
Supporting business expansion
ArcGIS guides location-based decisions:
- where to open a new branch or store,
- which regions show the greatest growth potential,
- where market demand is highest.
Combining demographic and sales data supports more accurate strategic decisions.
How integration with Power BI works
ArcGIS is embedded as a native visual inside Power BI — no separate tools required. The workflow is straightforward:
1. Add the ArcGIS visualization
You select it from the visualization panel like any other chart.
2. Assign location fields
Typical fields include:
- addresses,
- postal codes,
- cities/regions,
- geographic coordinates.
3. Automatic geocoding
ArcGIS automatically converts addresses into precise points on the map. This removes the need to prepare latitude/longitude values manually.
4. Adding geographic layers
You can enrich your report with:
- administrative boundaries,
- population data,
- population density,
- ArcGIS spatial data layers.
This provides context beyond simple point placement.
Key best practices
1. Ensure consistency in location data
Common issues include:
- varying city name formats,
- missing postal codes,
- incomplete addresses.
Standardized data improves the accuracy of geocoding.
2. Proper address preparation
It’s useful to unify address structures to minimize localization errors.
3. Choose the right level of aggregation
Not every analysis requires point-level mapping.
Depending on the scenario, more appropriate options might be maps by:
- country,
- province/region,
- city,
- individual sales points.
4. Simplicity and clarity
Maps should simplify interpretation. Therefore:
- avoid excessive layers,
- use clear legends and color schemes,
- don’t overcrowd the map with points,
- emphasize key insights.
Summary
ArcGIS for Power BI significantly enhances Power BI’s analytical capabilities. It enables the exploration of business data in geographic context, helping organizations:
- better understand sales and customer behavior,
- identify high‑potential areas,
- optimize logistics and operations,
- plan network expansion,
- make better, data‑driven decisions.
If your data includes a location component, ArcGIS for Power BI can dramatically improve your analytic depth and increase the value of your Power BI reporting environment.